Mar 24, 2013

Open Street Map’s Extend3D


Hello everyone! Several month ago we began a new project. The essence of the project is to create a web application of OSM 3D viewer and editor. So I'm going to tell you a few words about main directions of project, that we've been working on over the last months.

OSM data processing

First of all, we decided to create a script for OSM data processing. This script will parse OSM file, then it will select buildings, remove excess points, analyze a form of each building and try to recreate it using simple 3D objects. After all the received information will be added in the DB.

Visualization of three-dimensional landscape using OSM data

The task consists of developing a set of methods for visualization of 3D landscape allowing to display real-time area, that is scalable in size in various levels of detail for displayed surface. Effective implementation of these methods allows using of modern computers to conventional graphics cards.
The first step is generation of landscape tops using map of heights. It is necessary to break landscape on tiles (grid of three-dimensional nodes) and build a quad-tree which represents the LOD (level of detail) from them.

Schematic representation of the quad-tree:

   
The next step is texturing each tile corresponding OSM texture and setting the algorithm for selecting the desired detail.


3D object editor

Also we are developing 3D object editor using the Three-JS library. Possibility of rotation, scaling and movement of objects is implemented. The addition of such primitives as sphere, cube and cylinder is implemented too.


We can fill the landscape with buildings using these primitives, as well as custom objects. Soon we will add physics and improve usability.

Geometry Builder

User can create new difficult object from primitives using geometry editor, which will be built on the basis of object editor.
We will develop geometry builder using the constructive solid geometry library with the help of cgs-functions such as union, intersection, and subtraction.


Texture editor

Here you can see texture editor. 

User can drag the image to the page and select a few areas, then crop them and save to texture files that can be used, for example, in object editor.
Main features:
1.  Draggable handles
2.  Intersection control
3.  Possibility to select and crop multiple areas
Texture editor was developed using jQuery UI JavaScript Library (draggable handles and other UI elements) and jsDraw2D (Graphics Library for JavaScript).

GUI

GUI is being developed using HTML, CSS, jQuery, AJAX. Main idea is to select some instances and drag them to editor.
Content consists of three parts:
1.  Search
2.  Left menu
3.  Editor field
User can search different instances. Content (types and instances) will be filtered in a real-time by the word typed in search field.
Left menu will contain different types of objects, if you choose some object, first 20 instances of this objects will be shown, if you scroll down, next 20 instances will be shown (AJAX).
After selecting the instance, user can drag and drop it to editor field.

Nov 22, 2012

OSM maps 3-D viewer

        Not much time ago we were visited by Marek Kleciak. You can read about him in OSM wiki.
Marek had a lot of great ideas about improvement of OSM maps, so we decided to make something useful for OSM community.
        For this moment we had presentation of osm maps 3-D viewer. It was a demonstration program of working with osm maps. Some words about its work.
        Open street maps allow to export any desired region of the world to osm-file. We took part of Munchen for rendering. The program shows the ability of building 3-D objects only with 2-D data. For that time program renders only buildings, roads, parks and points of interest (restaurants, cafes).
        Renderer searches tags <landcover>, < landuse> with value forest, grass roads and convert lines in rectangular area and use textures for covering them. Unlike skyscraper, most buildings don't have information about height, so we make it random.
        The program can use 3-D model f.e. Frauenkirche, because the data is in form of nodes that consist of longitude and latitude.


Sep 1, 2012

Using QtDbus

Hello everyone! Our application consists of client and server parts. So for their communication we decided to use IPC(inter-process communication) system – Dbus, specifically QtDbus, because we already are using Qt in our project. To implement QtDbus in project you need to follow several steps:
  1.         Write the class, with slots, signals and properties using custom types.
  2.      Convert this class to xml file using qdbuscpp2xml.
  3.            Generate Adaptor and Interface from your xml file using qdbusxml2cpp.

        qdbusxml2cpp FileName.xml -a AdaptorName

       qdbusxml2cpp FileName.xml -p InterfaceName


After this you need to write your client and server parts. Writing client is pretty simple. You need to  include to client generated interface .cpp and .h files, and create interface that is described in .h file.
For example in our project it looks like


                DriverAssistant::DynamicPoi (SERVICE_NAME, PATH, QDBusConnection::sessionBus());


Now about server part, let’s divide it into simple steps.
  1.         Include generated adaptor .cpp and .h files.
  2.             Include class just like you wrote for generating .xml file with function realization.
  3.             Create an instance of the class and “feed” it to adaptor class constructor.
And don’t forget about adding CONFIG += qdbus in .pro files and #include <QtDBus/QtDBus> in client and server.

P.S. There are not as many examples as it should be, but we recommend you to see this.
Especially "ping-pong" as the smallest and the simplest one.


Aug 17, 2012

Some changes in our project

Our team decided to modify our application to the navigation system, with the ability to display the current location of the machine in real time. Unfortunately, according to the rules of Google Maps service we can no longer continue to use it. In this regard, we turn to use maps service OpenStreetMap. Soon we will publish a video that demonstrates how our application works. Follow the news!

Jul 26, 2012

Driver assistant

Hello everyone, we began a new project. The essence of the project is to create a browser-based navigator which use online maps of different services such as Google, Yandex, and others, which could display dynamic POI. Points of interest will be collected from various Internet resources to our server and than they will be provided upon navigators request . There also will be introduced the possibility of evaluating and commenting poi as anonymous user, and using various social networks accounts. First of all will be displayed comments of your friends. Soon there will be more information about our project and about what we have done. Wish us luck.

Jun 25, 2012

Tizen OS


Tizen is an open source mobile operating system. Tizen is based on the Linux operating system backed by the Linux Foundation and represented in the industry by Tizen Association. The operating system incorporates a number of modules such as network management from the MeeGo project, a combination of the mobile operating systems Moblin, created by Intel, and Maemo, created by Nokia. Development is led by companies gathered around Tizen Association, currently Samsung and Intel.
You can download SDK from official site.
SDK is available for Linux and Windows OS. SDK contains Emulator and IDE.
This SDK provides convenient tools for application development on Tizen OS.

Apr 4, 2012

Recognition of traffic jams from tiles

This week we reached new point of our project.

Now we receive and display the traffic jams from the Internet
You can see it on sсreens below

Using Hough method


Using method offered by Eugene Okhrimenko


The second method is more accurate, so we decided to use it.

Feb 16, 2012

what we have done for half a year?

Today 16 January and we already work with this project half a year. Our team want to sum up for our work.

When we have finished studying the structure of Navit, representation of data in it and ways of presenting data on the map, we have learned how to draw using the standard of navit for drawing graphic primitives.


After that, we were able to start writing the plugin. With our plug-in we were able to introduce to Navit another element, that has allowed to add to drawing queue of Navit our element, avoiding major modifications of the navit code. We have developed a structure for storing data, which is based on the use of double-linked list. For this purpose, we used the implementation of the list from the library GLib. After that, we are faced with the task of obtaining the data to draw the traffic jams. To solve this problem, we developed a service application that runs separately from Navit. At the core of our application is the technology of data exchange between independent applications using the bus DBus. Service-based application starts listening after execution on the bus at the request of the availability of necessary data about traffic jams. This query contains the coordinates of the drawing area for which you provide the data. After that the service application receives JSon string and sends it to our plugin.


Unfortunately, the use of DBus buses to transfer large amounts of data led to a significant slowdown, which is unacceptable. Because of that fact, we had to abandon this technology, so currently looking for an alternative for data on traffic jams. To emulate the movement of the machine, we have developed several short tracks in New York City and Odessa. Here is a video showing the work of one of them.


The next part our work - detecting Google traffic jams on the tiles.  The first, what we need is getting the tiles and combining them into one. 

Now, we work with image. Reading the pixel in this photo and cleaning it from extra colors.


Lines of the traffic jam is divided into three streams according with colors.  The transfer will also be in a three-streams.


Then we generate a json string and share it with the plugin. In the next screenshot you can see Navit window and Google traffic jams.


We put the green color (7fff00) and use two methods: the method of Hough and Kenny. Our algorithm isn't idial, but we identify and draw traffic jams in the Navit.

All the best,  
TNav team :)


Jan 26, 2012

work on the recognition of traffic jams

Hello everybody!
          We are working on the reading traffic jams from the pictures. The first what we need done - get the photos.  We are forming the URL in the c++, then use Wget are getting the tile.


Now, we have many photos with many line. A single image need  to make  from these pictures. ImageMagic excellent solves this problem.
     You can see on this picture many unnecessary elements. We worked with google map API documentations and changed link.
      Now we need to know the information about a road conditions from the image.
     But we have a problems with pixels on this picture. If enlarge the image you can see not the accuracy of the lines. We want solving this trouble on this week.

all the best,
Grygoryeva Oksana,
Semenakha Dima.

Jan 13, 2012


Gps simulation: screenshot shows New-York  map and simulation vehicle driving on street.


We are going to make traffic jam simulation and gps in next two days.


Dec 16, 2011

demonstration of work the service application.

Hi!!!
          You were reading about our first steps in a dbus on previous post. Now, we are showing you a result of our work. Information about a traffic jam was transferred by the dbus, you can see this on the vidio .
All the best, Grygoryeva Oksana.

Dec 9, 2011

Making deb package form our navit

Hello, last days I made a package and I used an article from
http://habrahabr.ru/blogs/linux/78094/
Also I read some information about shell. If you will create the own deb package, maybe you`ll have some problems with dependencies from some packages. If you`ll have them you must first to install absent package`s or libraries, or wrote some script which will install them instead of you. And only after this you may to install your deb package.

Dec 8, 2011

dbus low-level api
We used this article to implement dbus interface between our plugin and service.
We are going to switch to high-level api (C++ or glib-dbus-1)

Dec 1, 2011

Parser

Hello People!
In this week I wrote parser. If someone need help I used next links:

http://garajeando.blogspot.com/2011/06/how-to-install-jsoncpp-in-ubuntu-and.html

http://coolaj86.info/articles/json-c-example.html

http://joysofprogramming.com/json-c-libjson-tutorial/

Nov 12, 2011

Report about done work.


       Hello.
     In this post I will discuss the work of the past week. We share the work differently every time. In this week we work on:
First of all, we learned the way the text is drawn on the map. After searching through the contents of graphics.c file, a function displayitem_draw() was found. It draws all map elements. Elements, that are divided into primitive selement_polygon, element_polyline, element_circle, element_text, element_icon, element_image, are being transferred to that function. Primitive element_circle is used for drawing circles and ovals, and if the city’s name required, the function draw_text() is called. After that we learned that function label_line() is used for drawing primitive element_text. This function provides drawing names of the streets on the map. On the very beginning in case of demand to display text on the map, it was set up like *.bin  file, but then, using the label_line() function, we displayed our text on every street independent of which text was in the map file. The result of our work is shown below on pic.1.
Рiс.1. Dynamic displayed text instead of text stored in file
After that we learned how to change the color of displayed text and its size. The data about color of the text and its size are contained in the element structure. If we change it dynamically – we can affect the text drawing. The result is shown on pic. 2.
Рiс.2. Changing size and color of the text.
When we continued our work, we found a way to change the color of drawn streets. We learnt that all color-providing data is also being stored in the element structure. When we choose necessary color and add it to the NAVIT color list, we substitute it to the structure dynamically. Acting that way, we learnt how to control the color of lines. The result is shown on pic.3.
After that we began working on changing the line color only in some areas. We found out where the coordinates of element being drawn are stored, and after that we tried to bind the streets’ colors to coordinates. The result of our work is shown on the pic.4.
Pic.4. Changing streets’ colors with coordinates binding.
Unfortunately it was clear that not only color of current line was changed, but the color of all lines of this type in this area, whose dots are in the selected area.
As a result of this work we learned how to display necessary text as an overlay of streets. Also we found out how to set parameters of this text and the color of the streets. Acting that way, we got to the main problem – displaying the traffic jams with different colors. The main problem which interferes with this is unavailability of changing color of the streets in determined area.


Secondly. Work with Map API. Its very easy to use Map API to Add new Items on map. We have to test element drawing in street layout (because we are using route_street as example). You can see a new line on the photo.
Green line was added by us.


Thank you for your attention.
With best wishes, the team TNav.)))


Nov 1, 2011

plugin's architecture

We worked over plugin's architecture on the last week. You can see at the photo our result.
On the first photo you can see Navit architecture. The frame, where have the asterisk, will be change.
On the second photo you can see  plugin's architecture.
We studied cppunit on the last week.

Oct 20, 2011

GPS-emulation with our foursquare.

Good day!
    We have got a new local work on Monday and have done it on Wednesday.

     You can see on the video. This's GPS-emulation but circle, who's describe replaces the car, is in the foursquare. This's was part of our work on this week.
I wait you comments)))
Goodbye!!!

Oct 19, 2011

Good day!

Good day!
     Today, I want to speak about birthday. Everybody has a birthday. At the last week We were invited to Luxoft company birthday. In the shopping city "Riviera" was drift show and banquet to the fifth birthday.
  
You can see on the video drift show for Luxoft company birthday.
Watch video and relax)))
a good view, Goodbye!!! 


Oct 17, 2011

What we have done on last week!?

     Good day!
 Our team wrote a function for displaying line on the screen.

We can change her location on the display monitor, can change her thickness and length. But we haven't synchronization with map. We work at this problem today. 
Wish us luck!)))
Goodbye!!!)))

Result of our work after two month.

Hello!
I'll tell you about our  done work for a period of 2 months.
When Dmitriy Kushnir has visited us, we have shown him the results our work.
  We have done:
- Google&Yandex maps synchronization;
- Adding the menu item from the plugin;
- GPS-emulator;
- Tnav-blog creation.

And now we will consider this items detail.
The first, we would like to show you Google and Yandex synchronization.

Yandex  map you can see at the top of the image, and Google map lower. If we moving on the Google map we can see changes on another map. We wrote a program which helping combine two different maps. This program is very comfortable to use for user and developer. You can use Yandex traffic jams at the same time with Google panorama. From the technical side, you don't need to teach API different maps.

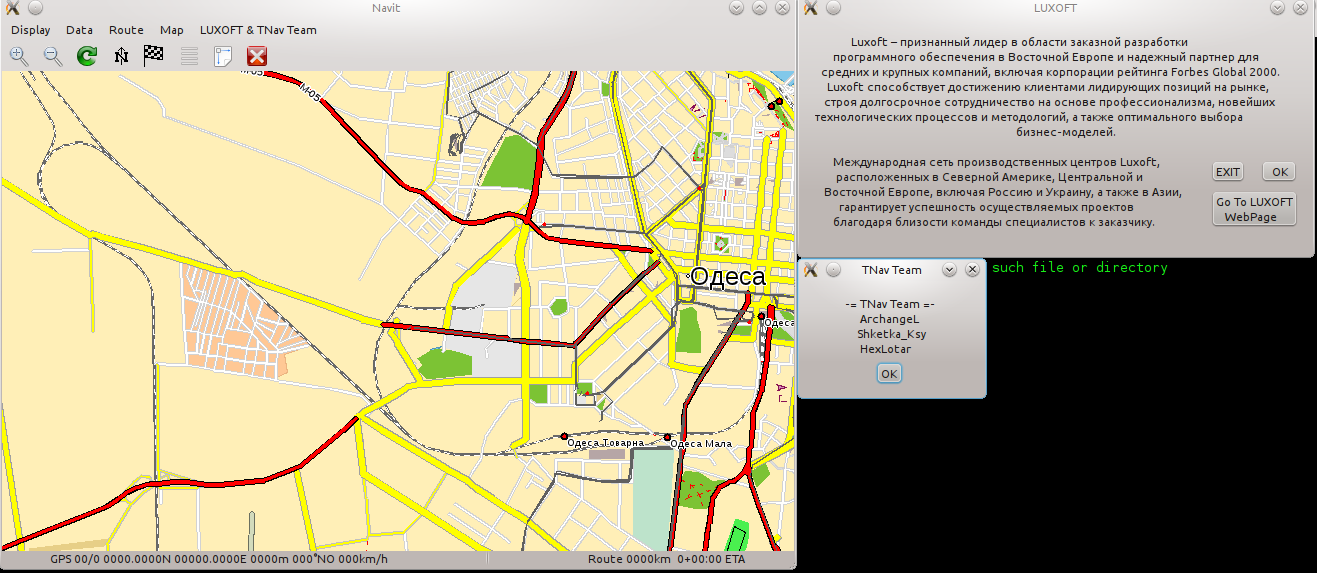
 Secondly. We adding the menu item in the Navit GUI (graphical user interface) which displays a windows.

The first window, display our names, and the second window, shows the short information about Luxoft company. There is two buttons: ok button, exit button and button to go to oficial website. If you click on button "Go to the LUXOFT WebPage" you can see official Web-page company where we work.
 In this page you can see newest information about result of work and activity Luxoft company.

And the last. We configured the GPS-emulator.

Why we do it? We need test our program codes and we haven't gps. For validation of our code used GPS-emulator. We use gps-tracks, which loaded from the Internet for free.
That's all.
Thank you for your attention.
Goodbye.