Hello.
In this post I will discuss the work of the past week. We share
the work differently every time. In this week we work on:
First
of all, we learned the way the text is drawn on the map. After searching through
the contents of graphics.c file, a function displayitem_draw() was
found. It draws all map elements. Elements, that are divided into primitive
selement_polygon, element_polyline,
element_circle, element_text, element_icon, element_image, are being transferred to that function.
Primitive element_circle is
used for drawing circles and ovals, and if the city’s name required, the
function draw_text() is called. After that we learned that
function label_line() is used
for drawing primitive element_text. This function provides drawing names of the streets on the
map. On the very beginning in case of demand to display text on the map, it was
set up like *.bin file, but then, using
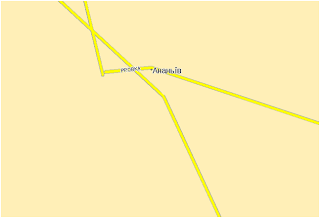
the label_line() function, we
displayed our text on every street independent of which text was in the map
file. The result of our work is shown below on pic.1.
Рiс.1. Dynamic displayed text instead of text
stored in file
After that we learned how to change the
color of displayed text and its size. The data about color of the text and its
size are contained in the element structure.
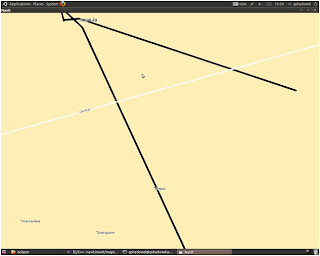
If we change it dynamically – we can affect the text drawing. The result is
shown on pic. 2.
Рiс.2. Changing size and color of the text.
When we continued our work, we found a way
to change the color of drawn streets. We learnt that all color-providing data
is also being stored in the element structure.
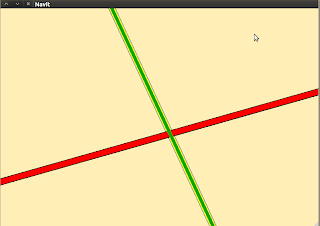
When we choose necessary color and add it to the NAVIT color list, we
substitute it to the structure dynamically. Acting that way, we learnt how to
control the color of lines. The result is shown on pic.3.
After that we began working on changing
the line color only in some areas. We found out where the coordinates of
element being drawn are stored, and after that we tried to bind the streets’
colors to coordinates. The result of our work is shown on the pic.4.
Pic.4.
Changing streets’ colors with coordinates binding.
Unfortunately it was clear that not only
color of current line was changed, but the color of all lines of this type in
this area, whose dots are in the selected area.
As a result of this work we learned how to
display necessary text as an overlay of streets. Also we found out how to set
parameters of this text and the color of the streets. Acting that way, we got
to the main problem – displaying the traffic jams with different colors. The
main problem which interferes with this is unavailability of changing color of
the streets in determined area.
Secondly.
Work with Map API. Its very easy to use Map API to Add new Items on map. We
have to test element drawing in street layout (because we are using
route_street as example). You can see a new line on the photo.
Green line was added by us.
Thank you for your attention.
With best wishes, the team TNav.)))


No comments:
Post a Comment