
Today 16 January and we already work with this project half a year. Our team want to sum up for our work.
When we have finished studying the structure of Navit, representation of data in it and ways of presenting data on the map, we have learned how to draw using the standard of navit for drawing graphic primitives.
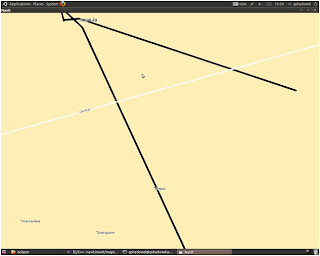


Then we generate a json string and share it with the plugin. In the next screenshot you can see Navit window and Google traffic jams.

When we have finished studying the structure of Navit, representation of data in it and ways of presenting data on the map, we have learned how to draw using the standard of navit for drawing graphic primitives.


After that, we were able to start writing the plugin. With our plug-in we were able to introduce to Navit another element, that has allowed to add to drawing queue of Navit our element, avoiding major modifications of the navit code. We have developed a structure for storing data, which is based on the use of double-linked list. For this purpose, we used the implementation of the list from the library GLib. After that, we are faced with the task of obtaining the data to draw the traffic jams. To solve this problem, we developed a service application that runs separately from Navit. At the core of our application is the technology of data exchange between independent applications using the bus DBus. Service-based application starts listening after execution on the bus at the request of the availability of necessary data about traffic jams. This query contains the coordinates of the drawing area for which you provide the data. After that the service application receives JSon string and sends it to our plugin.
Unfortunately, the use of DBus buses to transfer large amounts of data led to a significant slowdown, which is unacceptable. Because of that fact, we had to abandon this technology, so currently looking for an alternative for data on traffic jams. To emulate the movement of the machine, we have developed several short tracks in New York City and Odessa. Here is a video showing the work of one of them.
The next part our work - detecting Google traffic jams on the tiles. The first, what we need is getting the tiles and combining them into one.

Now, we work with image. Reading the pixel in this photo and cleaning it from extra colors.
Lines of the traffic jam is divided into three streams according with colors. The transfer will also be in a three-streams.

We put the green color (7fff00) and use two methods: the method of Hough and Kenny. Our algorithm isn't idial, but we identify and draw traffic jams in the Navit.
All the best,
TNav team :)
No comments:
Post a Comment